How to Find and Fix Memory Problems in Android App

This blog aims to offer a concise overview of the procedures employed to detect memory leaks in our Android application and confirm the effectiveness of the implemented solutions.
Our approach involves utilising two primary tools: the Leak Canary library and the Memory Profiler in Android Studio.
Memory allocations, which come from creating new objects in code, can cause significant system work. Not only do the allocations themselves require effort from the Android Runtime (ART), but freeing these objects later (garbage collection) also requires time and effort.
Leak Canary
Given its high effectiveness and user-friendly nature, this library functions as our main detection tool for identifying leaks. The process entails enabling the library in our project's build.gradle file, running the application, and conducting various user-level scenarios and interactions.
Once a leak is detected, the library provides us with stack traces associated with each leak, which helps us identify exactly where undesired references to the leaked objects are being held.
The official documentation elaborates on how to read the stack traces quite effectively: https://square.github.io/leakcanary/fundamentals-how-leakcanary-works/
Memory Profiler
There are two main reasons the memory profiler is an extremely important accessory to the Leak Canary library:
- It gives us an actionable metric in the form of overall Java stack size, which can be monitored pre and post-fixes to identify the scale of improvements.
- It is the only way to differentiate between two different kinds of memory leaks :
The following is a step-by-step guide to using the memory profiler:
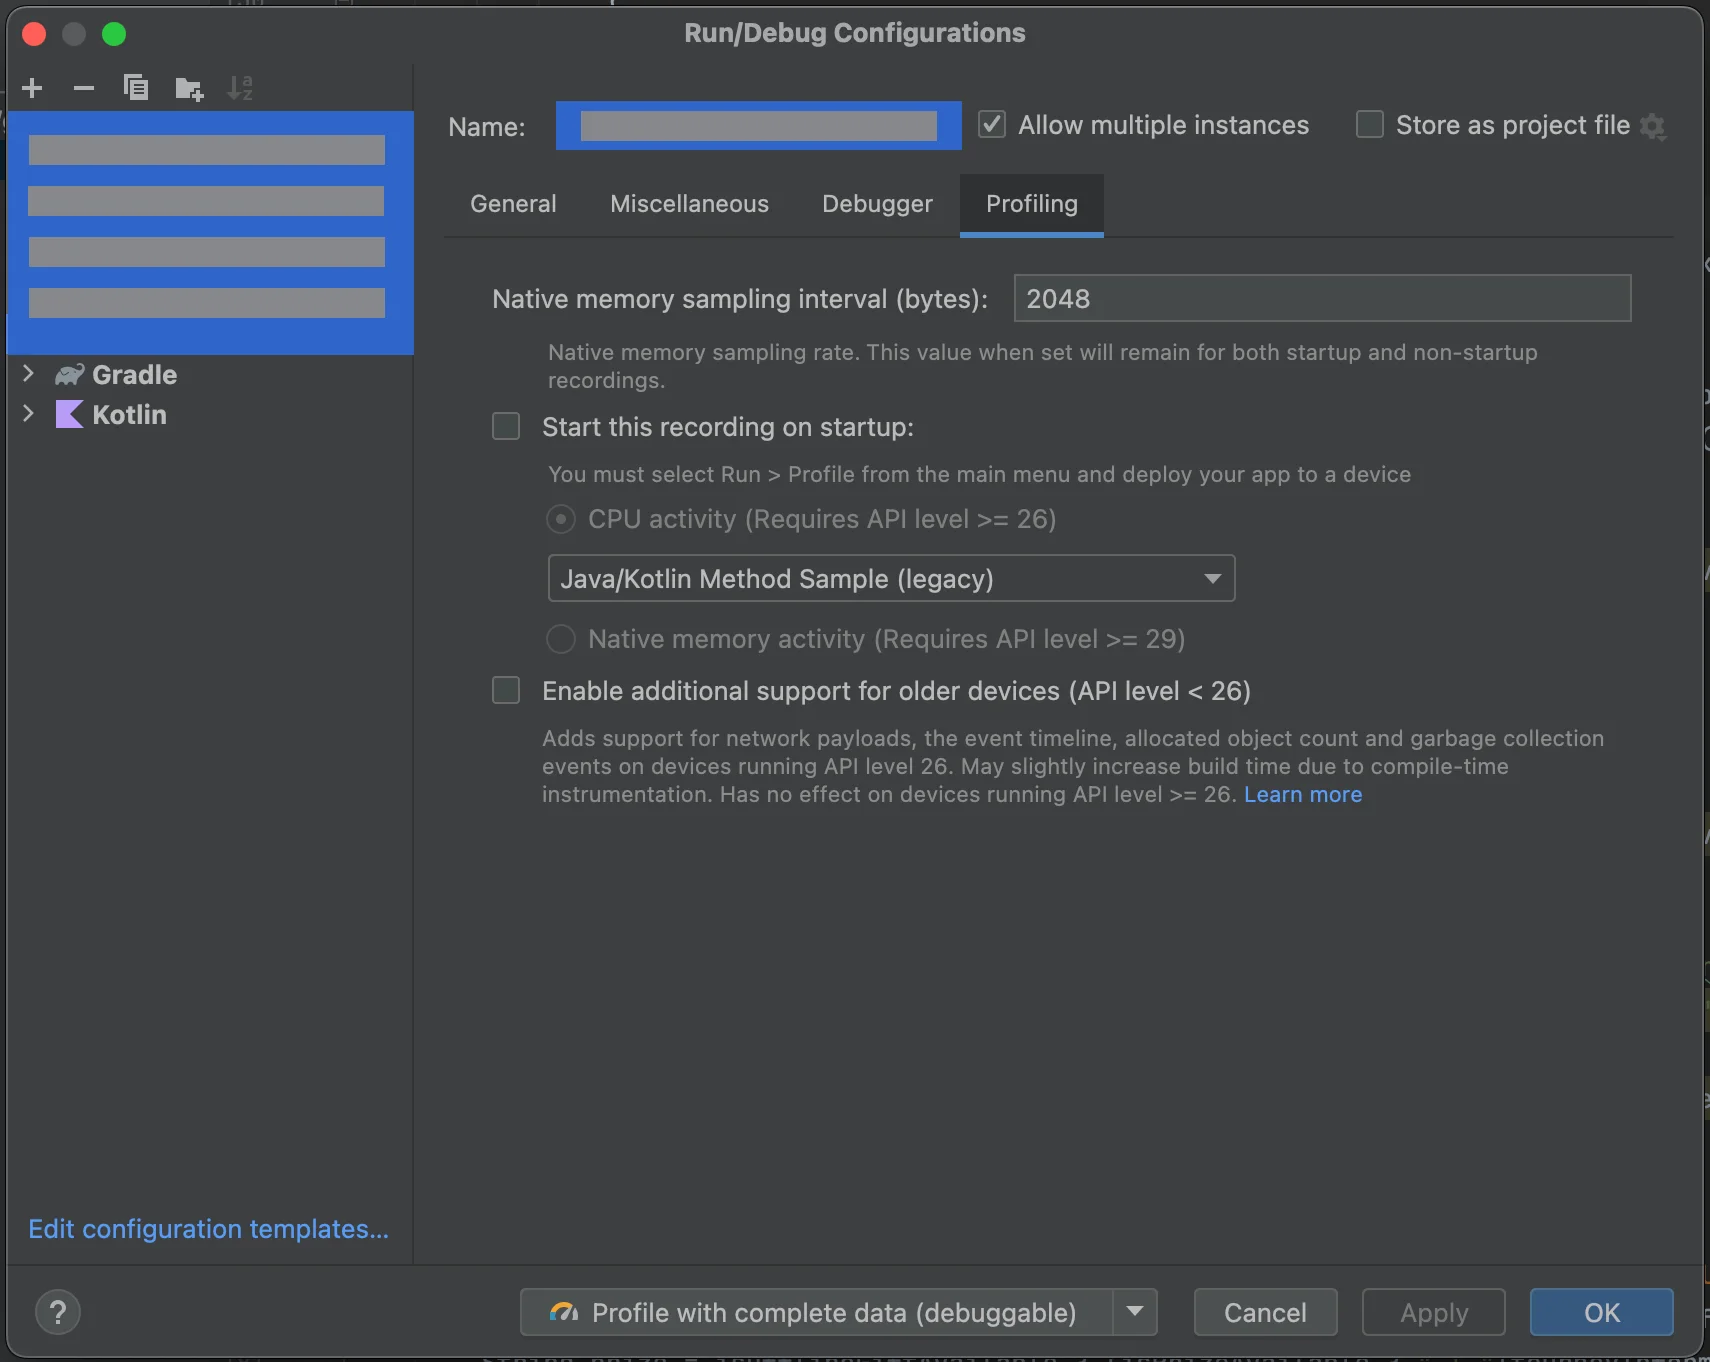
- Edit Configurations: To be able to capture a heap dump at any given point of running the app, we are required to switch off recording from scratch in the profiler configurations, before we run the profiler. This is done through : Edit Configurations → Profiling → Start this recording on startup ( Unselect this option )
- Profile the app with complete data ( debuggable )
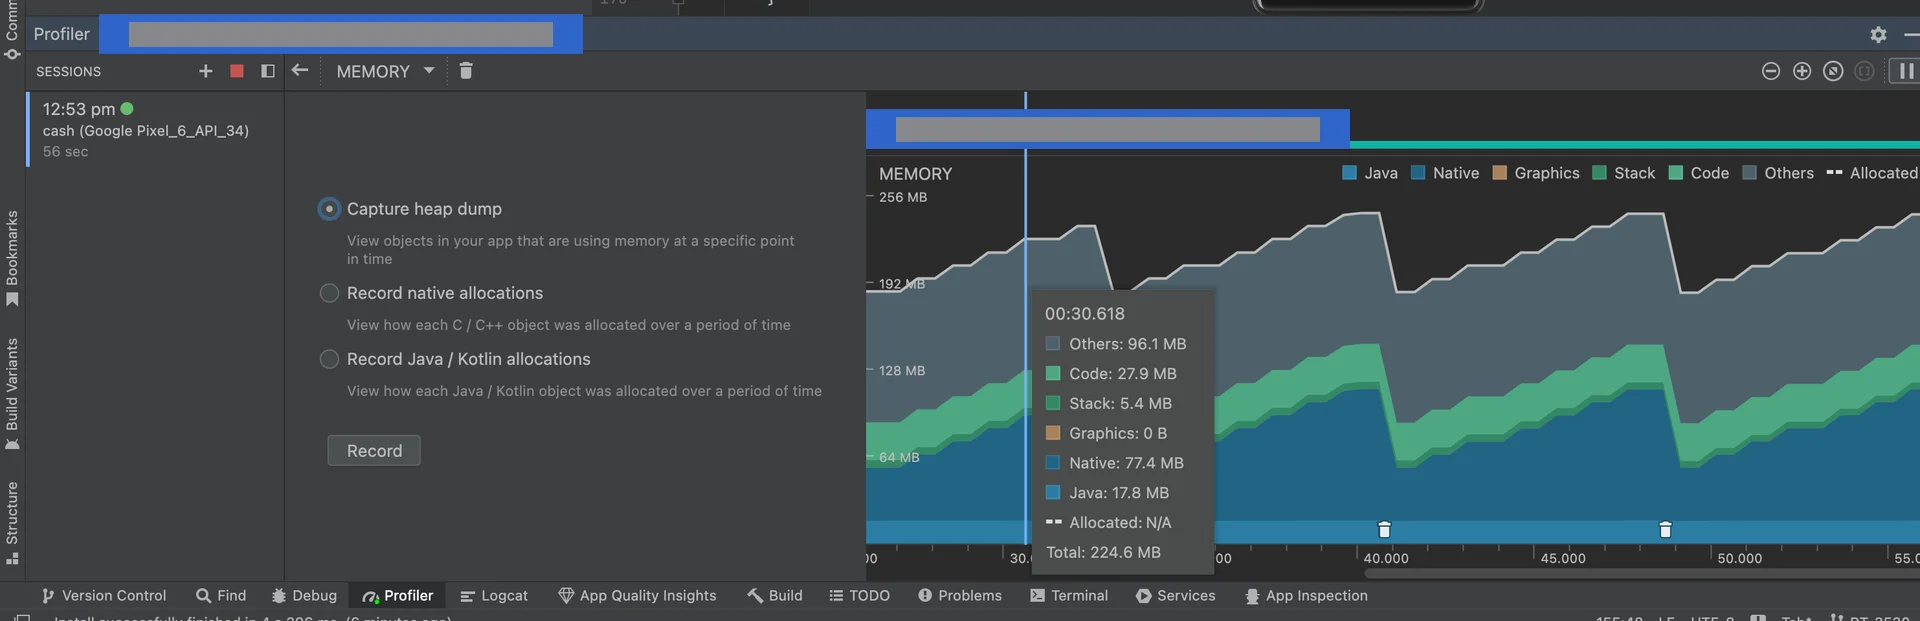
- The memory tab: Once the profiler is running, switch to the memory tab, the heap dump can be captured at any given point, and the live memory graph can be monitored for memory allocation. We are concerned with the Java section of the memory values as that represents the controllable memory usage by objects created through our code.
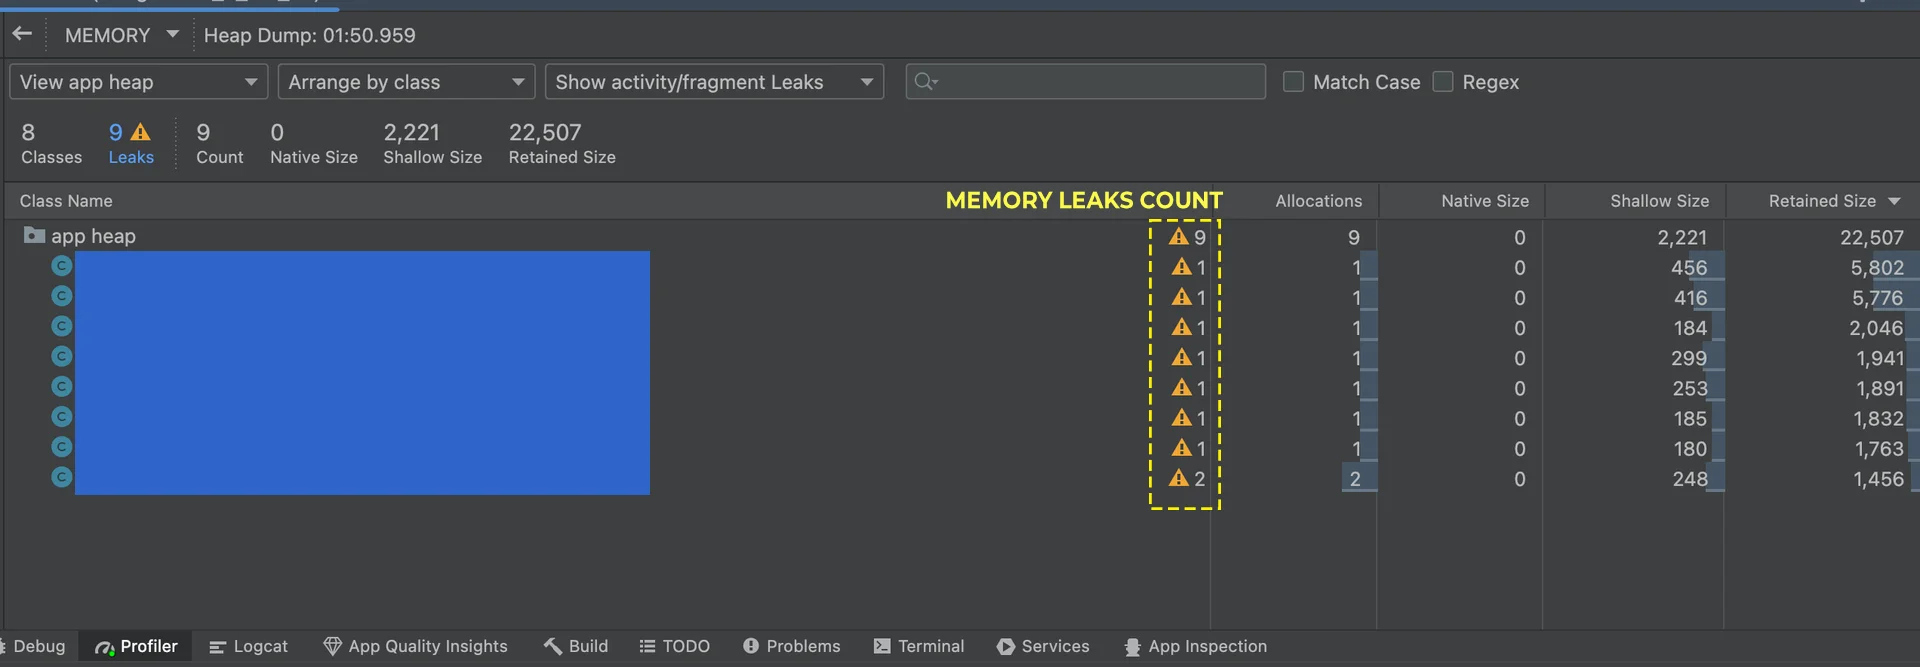
- Read the heap dump Each heap dump tells us all the objects present in our code with the size they occupy, as well as a section for detected memory leaks, the objects that are leaked, and how many instances of that leaked object are present in code under the Allocations column, the last point being the determining factor in identifying the two different kinds of memory leaks as discussed earlier.
The memory profiler can be studied in depth beyond the minimum required for our use case from the official Android documentation:
https://developer.android.com/studio/profile/memory-profilerResults:
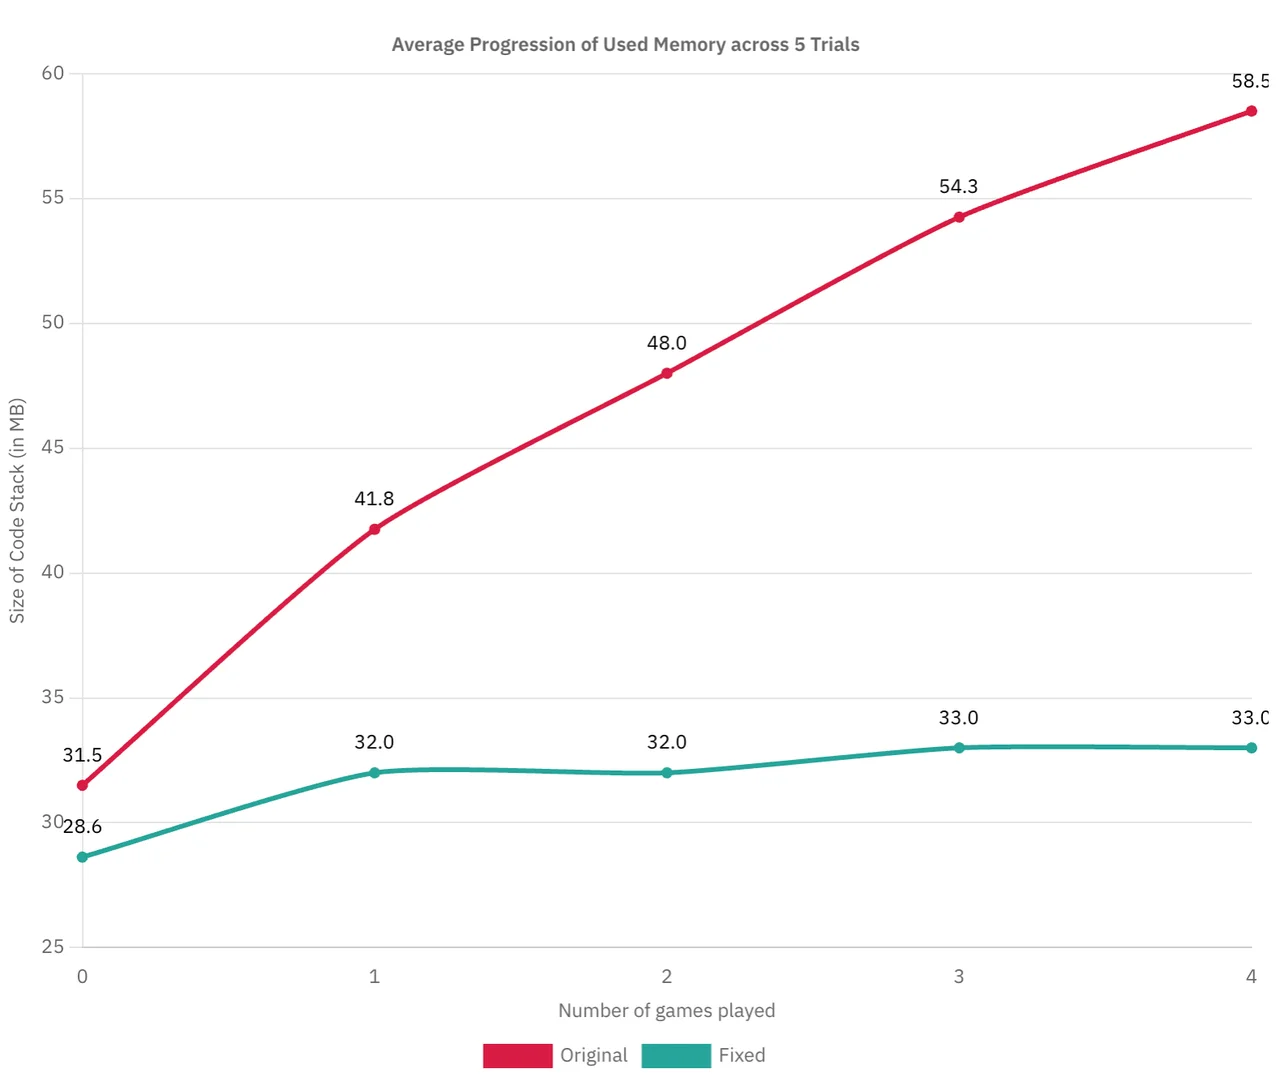
Our first iteration of this process focused on detecting and resolving issues in user flows that are most frequently accessed. This resulted in establishing a lower baseline as well as a significant decline in memory retention during a typical usage session. The subsequent graph illustrates these enhancements.
Author: Abdullah Mujtaba, SDE-II, Head Digital Works